


|
|
|
Top Artists |
Top Songs |
Top Albums |
Show Albums | Show Songs |
This website presents a consolidated list of the albums and songs that have been on top of the music charts since 2000. It employs charts from the USA, UK, Germany, France, Canada, Australia, Italy and Spain to work out the top songs and albums for every day, month and year between 1 Jan 2000 and 31 Dec 2024. This is version 0.3.0074 of the data and was processed on Thu, 23 Jan 2025 14:57:39 GMT.
The site consolidates 2,299,957 weekly chart entries (1,250,200 about albums and 1,049,757 about songs). These entries contain 50,844 distinct artist names, 57,623 song names and 67,089 album names. The site lists the overall top 1000 artists, 2000 songs and 2000 albums (each with a plot to show how success varies through time) as well as providing charts for every year, month and even every day between 1 Jan 2000 and 31 Dec 2024.
This website is the modern equivalent of //tsort.info/, a website that combines music charts starting in 1900. For that site the scarcity of source data (especially for the years before 1950) means that every available chart has to be employed. In contrast this site can rely on the fact that since the year 2000 extensive and trustable charts are available for all the largest music markets. This allows us to estimate the worldwide top 10 songs for every single day.
Most of the pages on this site provide summary information, for example the daily, monthly and annual charts, details about the top songs, albums and artists. All pages have a comment box at the bottom to allow you to ask questions, point out mistakes and suggest improvements.
This page is different from the rest of the site, in that is contains quite a lot of text (the other pages attempt to minimise text in order to make finding the information easier). This page provides the background to explain where the original data came from, how the site is generated and who we are. It has the following sections:
In addition to providing web pages we have also created some data files that let the reader do further analysis (should they want to). The following data files are available for download:
Following a suggestion from one of our readers we also provide CSV files listing the top songs and albums of each decade covered:
All this data is copyright and should only be used if the original source (i.e. this web site) is credited and the version number is mentioned (which for this data is 0.3.0074). We have no issue with applying this data for personal use, or with people that use the data and tell everyone where it came from, those who use these results and attempt to pass them off as their own work are liable to have action taken against them.
The charts used are the best ones available for each country, we have only used charts that are considered "notable" according to the definitions used by Wikipedia. This has limited the data that we can get hold of. At the moment the following chart data is being used:
| Source | Coverage | |
| USA | //www.billboard.com | Top 100 songs and top 200 albums each week |
| UK | //www.officialcharts.com | Top 100 songs and albums each week |
| Germany | //www.offiziellecharts.de | Top 100 songs and albums each week |
| France | //lescharts.com | At least top 100 songs and top 75 albums each week |
| Canada | Wikipedia and //www.billboard.com | RPM number 1 singles for 2000. Billboard top 100 singles after 2007. Top 10 albums from 2000 - 2007 and at least top 25 albums after 2007 |
| Australia | //australian-charts.com | Top 50 songs and albums each week |
| Italy | //italiancharts.com | Top 20 songs and albums each week |
| Spain | //spanishcharts.com | Top 100 albums each week from 2005 and top 50 songs (only top 20 between 2000 and 2008) |
| Netherlands | //www.dutchcharts.nl | Top 100 albums and singles each week |
Many of these sites have dates with no entries and individual positions missing in otherwise good charts. In addition the names of artists, songs and albums are inconsistent (both between charts and even from week to week in the same chart).
The first and most obvious challenge with all these sources is inconsistency. Take as an example the song "It wasn't me", in the US, UK and French charts we have the following entries:
| Chart | Week | # | Artist | Song |
| Billboard | 16 Dec 2000 | 4 | Shaggy Featuring Ricardo 'RikRok' Ducent | It Wasn t Me |
| 13 Jan 2001 | 2 | Shaggy Feat. Ricardo 'RikRok' Ducent | It Wasn't Me | |
| UK Chart | 18 Feb 2001 | 37 | Shaggy | It Wasn't Me |
| 25 Feb 2001 | 37 | Shaggy Ft Rikrok | It Wasn't Me | |
| France | 17 Mar 2001 | 4 | Shaggy feat. RikRok | It Wasn't Me |
To a human being it is obvious that all these entries refer to the same song, by the same combination of artists. It is, however, quite hard for a computer program to correctly identify that fact without also generating false positive matches. Even the fact that the name in the first row is missing the apostrophe would make a naïve program fail. When entries are laid out next to each other these types of anomalies are easy to spot. In this case these five entries were hidden in the 100 positions listed in each of the weeks shown.
During the period covered by this site there was a large number of songs that were attributed to "featured" artists. This makes matching artist names particularly difficult (and also makes properly assigning the credit rather problematic). We've attempted to assign each song to a combination of artists in a consistent way (and not use the word "featuring").
Say we select a random date, for the sake of argument the 12th Feb 2009 (just because it was the 200th anniversary of the birth of a great man). What did the various pop charts look like on that particular Thursday?
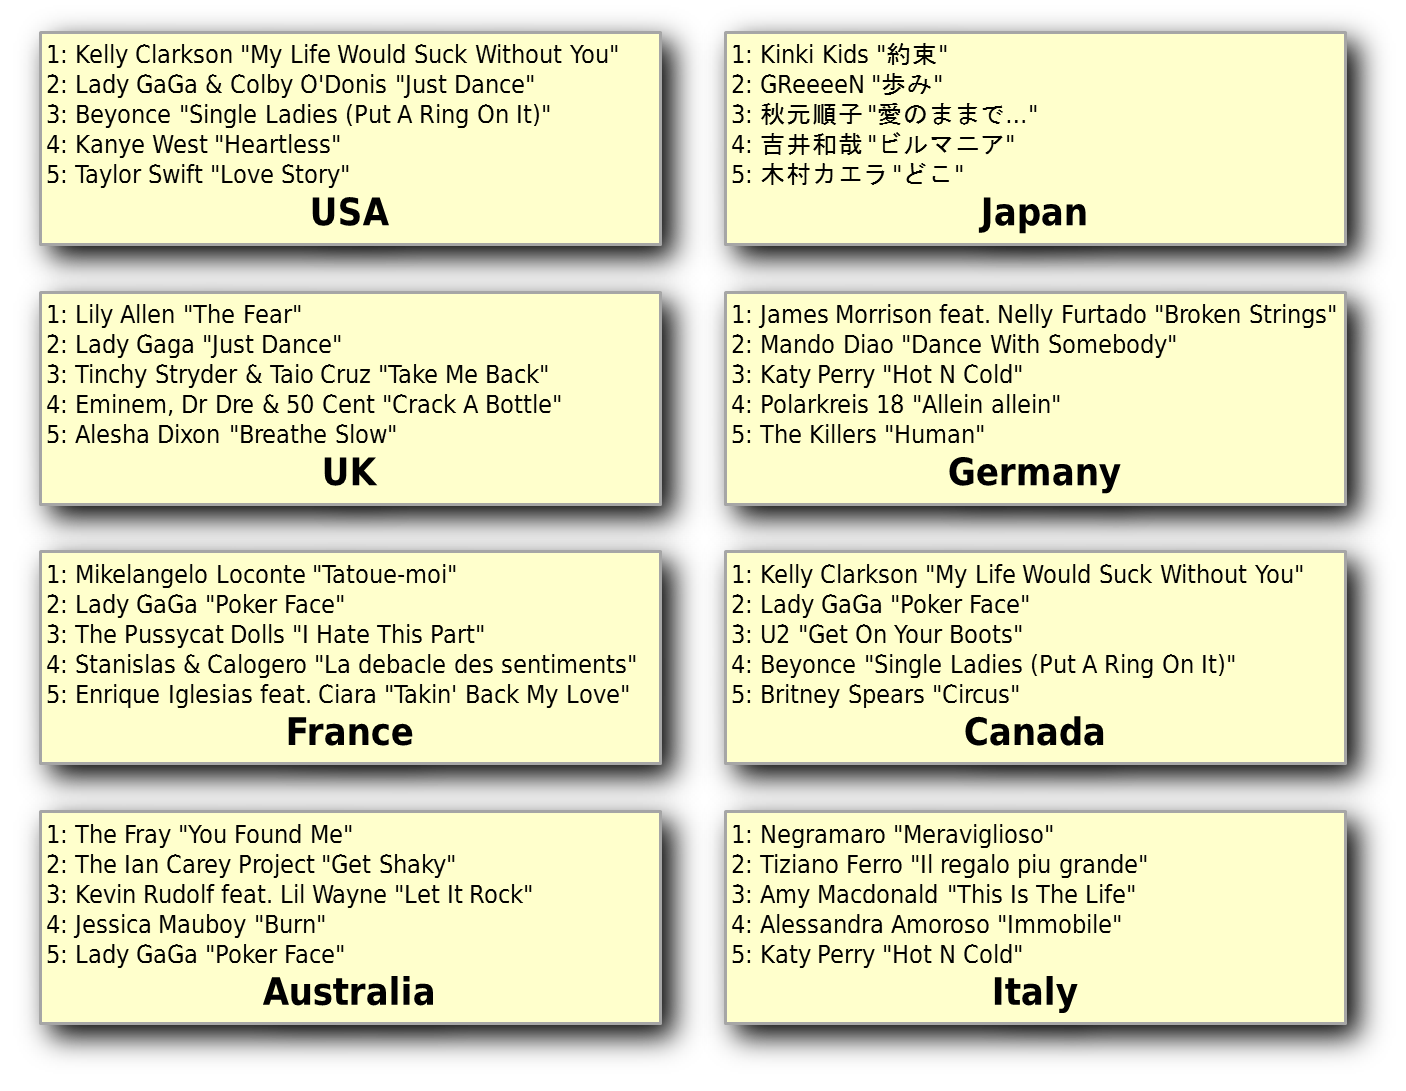
In these eight countries the top 5 songs were those shown above. Now, before we go any further, I would like to apologise to any reader who understands Japanese, I am confident that the entries as listed contain some stupid mistakes. There are a few other things that are obvious, even from this short list:
If we want to consolidate these types of charts then a few base ground rules will be required. First the correct handling of non-ASCII characters raises all sorts of issues, so all entries will have to be converted to ASCII. In cases where accents should be used it is easy enough for the reader to fix the issues later. Secondly the chart from Japan is just too difficult to convert. Now luckily this doesn't impact us much as most Japanese hits appear nowhere else. It unfortunate but to make the processing tractable we just have to ignore Japanese charts until someone shows us how to deal with them.
Having identified all the songs that were in the charts on a particular day how should we present them? One option would be to just list them, but given that we have both many more entries within each chart than just these 5 and more than just these 8 charts that could be excessive. The obvious way to identify the "biggest hit" is to assign each item some kind of score and only list the highest achievers.
In order to work out which song to give most credence to we have to convert positions in weekly charts into some kind of "score". Obviously the number 1 record in a particular chart gets more points than the number 2 record and so on, and just as clearly the difference between say the 10th and 11th position is greater than that between the 30th and 31st. So we know that the score function has to be some kind of descending curve that flattens out, like the curve of 1/x or 0.5x.
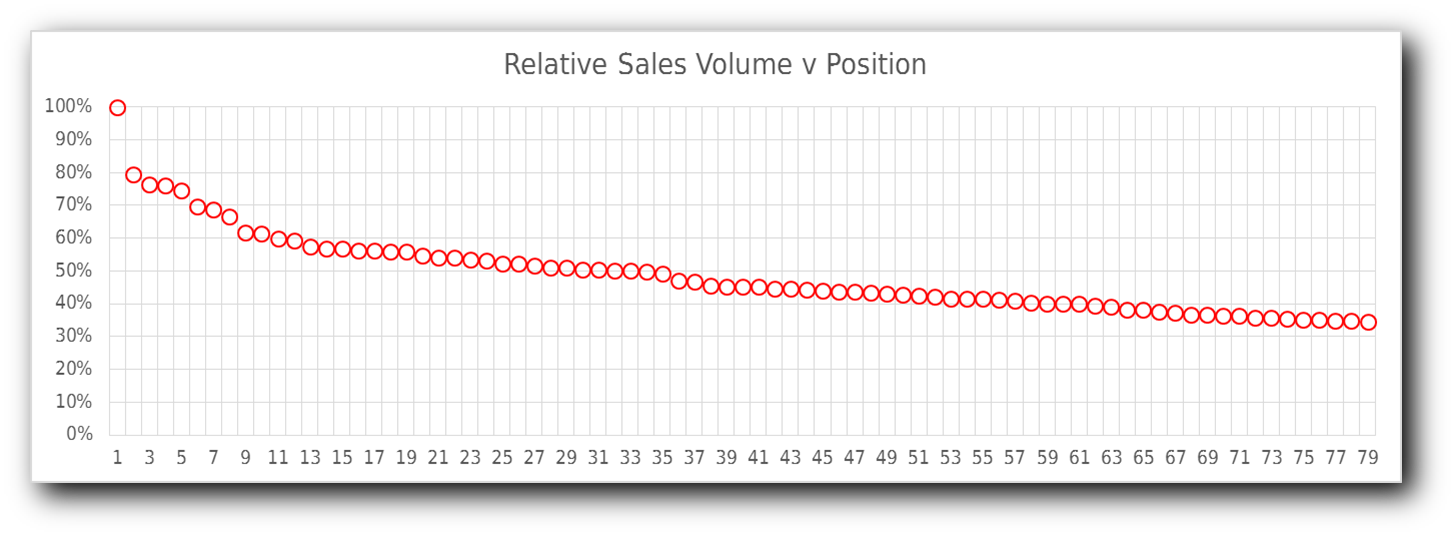
Luckily we have some data that relates sales volume of music to positions in a chart, this is from our companion site, //tsort.info/. If we try to match this curve with either a reciprocal or power law one then the shape fails to match, both those curves overemphasise the "middle ranking" positions.
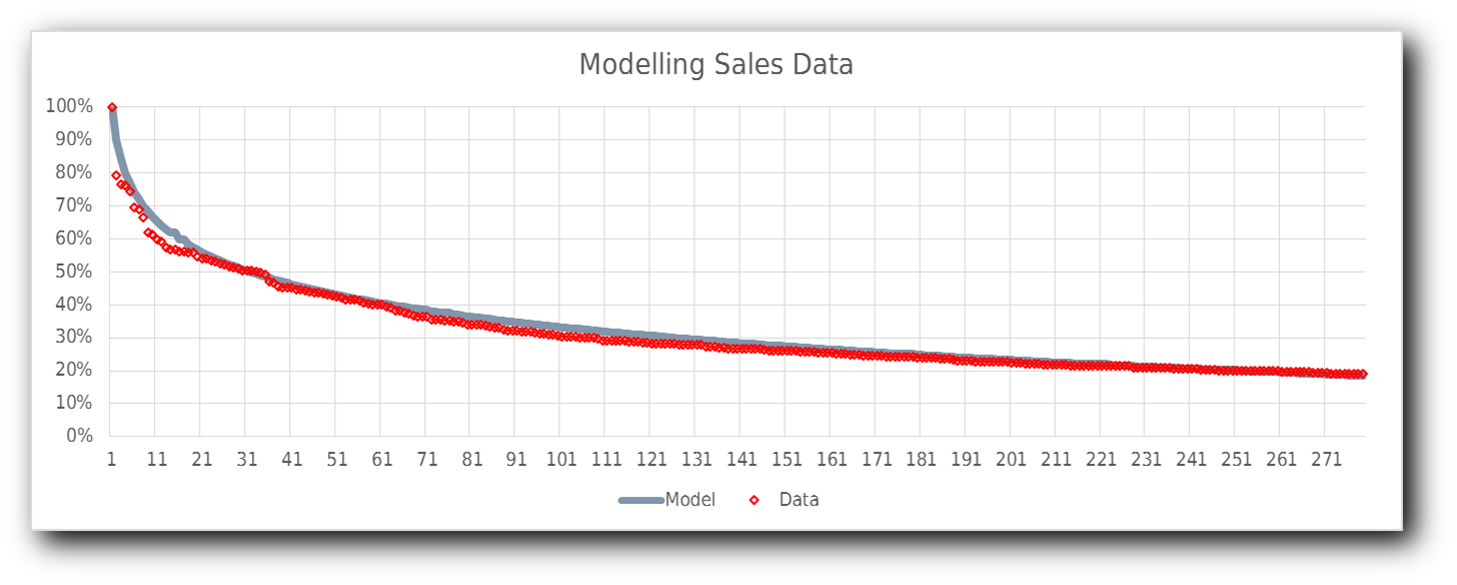
The simplest formula that we found to match this data is:

When we actually tried using this formula to assign scores we found that it was overestimating the impact of the lower positions in the chart, so in our calculations we replaced the 3 with 2.5 and ensured that we limited it to positions above 300;
Since the year 2000 the IFPI (International Federation of the Phonographic Industry) has published an annual report that provides estimates of the revenue generated by the music industry in different countries. This does not provide a complete chart for all years so we have had to interpolate some values. With those interpolations we have the following (numbers are millions of US dollars);
| # | Name | TLD | 2000 | 2001 | 2002 | 2003 | 2004 | 2005 | 2006 | 2007 | 2008 | 2009 | 2010 | 2011 | 2012 | 2013 | 2014 |
| 1 | USA | us | 14042 | 13412 | 12609 | 11848 | 12153 | 11195 | 9651.4 | 7985.6 | 5977.4 | 4562.0 | 3635.2 | 4372.9 | 4481.8 | 4473.5 | 4898.3 |
| 2 | Japan | jp | 6496.9 | 5253.6 | 5000.9 | 4909.7 | 5167.8 | 4883.5 | 4495.2 | 4174.5 | 5171.1 | 4244.5 | 4096.9 | 4087.7 | 4422.0 | 3012.0 | 2627.9 |
| 3 | UK | uk | 2828.7 | 2808.7 | 2936.0 | 3215.7 | 3508.7 | 3330.4 | 3051.1 | 2696.4 | 2274.9 | 1730.5 | 1388.1 | 1433.7 | 1325.8 | 1303.5 | 1334.6 |
| 4 | Germany | de | 2420.6 | 2128.6 | 2090.8 | 2022.1 | 2149.0 | 2146.4 | 2029.1 | 2142.2 | 2370.0 | 1945.8 | 1713.6 | 1473.7 | 1297.9 | 1365.1 | 1404.8 |
| 5 | France | fr | 1694.7 | 1828.3 | 2070.1 | 2114.7 | 1979.3 | 1940.3 | 1661.7 | 1471.0 | 1342.5 | 1157.5 | 999.6 | 1002.2 | 907.6 | 956.2 | 842.8 |
| 6 | Canada | ca | 819.3 | 659.9 | 621.2 | 676.0 | 693.8 | 708.3 | 667.8 | 561.8 | 530.0 | 401.6 | 343.2 | 434.0 | 453.5 | 424.1 | 342.5 |
| 7 | Australia | au | 561.3 | 522.5 | 532.2 | 673.8 | 716.7 | 637.7 | 583.6 | 564.8 | 555.3 | 456.2 | 408.0 | 475.2 | 507.4 | 430.8 | 376.1 |
| 8 | Italy | it | 532.2 | 524.7 | 564.9 | 644.6 | 652.5 | 639.8 | 556.9 | 493.3 | 427.0 | 293.8 | 275.4 | 239.9 | 217.5 | 238.8 | 235.2 |
| 9 | Spain | es | 562.9 | 613.0 | 551.0 | 595.9 | 572.8 | 547.1 | 464.8 | 374.3 | 374.3 | 266.8 | 183.2 | 190.0 | 166.6 | 150.7 | 181.1 |
| 10 | Nether-lands | nl | 455.0 | 435.7 | 440.3 | 498.8 | 507.7 | 423.1 | 383.4 | 385.0 | 365.5 | 340.6 | 270.2 | 240.2 | 216.3 | 205.6 | 204.8 |
| 11 | Brazil | br | 724.7 | 423.5 | 388.9 | 304.9 | 374.2 | 390.8 | 322.7 | 246.5 | 349.0 | 246.9 | 258.7 | 262.6 | 257.2 | 227.9 | 246.5 |
| 12 | Mexico | me | 665.9 | 565.8 | 462.1 | 346.5 | 360.0 | 410.5 | 357.1 | 273.9 | 217.1 | 160.3 | 157.9 | 141.2 | 144.5 | 135.4 | 130.3 |
| 13 | Russia | ru | 197.0 | 223.0 | 258.1 | 326.2 | 490.8 | 387.6 | 405.0 | 418.8 | 395.2 | 185.7 | 126.2 | 130.1 | 128.8 | 117.5 | 117.0 |
| 14 | Sweden | se | 322.9 | 286.5 | 287.3 | 295.0 | 267.9 | 235.0 | 214.5 | 206.5 | 205.1 | 162.3 | 136.8 | 155.3 | 176.7 | 194.2 | 189.4 |
| 15 | Austria | at | 289.1 | 253.2 | 251.2 | 282.1 | 288.6 | 276.9 | 277.2 | 277.2 | 257.8 | 225.7 | 184.1 | 118.9 | 96.2 | 119.7 | 114.9 |
| 16 | Belgium | be | 266.8 | 233.4 | 233.4 | 250.7 | 275.1 | 324.6 | 314.1 | 231.4 | 249.3 | 202.9 | 187.6 | 140.5 | 121.5 | 114.1 | 111.2 |
| 17 | Switzer-land | ch | 264.0 | 274.1 | 253.2 | 256.3 | 258.8 | 262.6 | 228.0 | 216.7 | 230.6 | 192.4 | 166.1 | 158.3 | 128.5 | 115.6 | 108.2 |
| 18 | Norway | no | 232.3 | 216.2 | 251.1 | 255.7 | 273.8 | 249.6 | 219.7 | 224.6 | 203.0 | 159.9 | 131.4 | 115.1 | 118.3 | 120.0 | 119.9 |
| 19 | South Korea | kr | 299.7 | 265.8 | 221.6 | 162.4 | 132.8 | 111.1 | 80.7 | 80.7 | 118.4 | 93.3 | 116.9 | 199.5 | 187.5 | 211.3 | 265.8 |
| 20 | South Africa | za | 150.4 | 120.6 | 115.0 | 160.4 | 236.5 | 253.2 | 242.7 | 237.1 | 195.7 | 162.8 | 171.8 | 102.0 | 101.0 | 92.1 | 91.7 |
| 21 | Denmark | dk | 233.3 | 193.0 | 168.8 | 176.9 | 187.4 | 177.7 | 169.7 | 169.7 | 150.9 | 126.9 | 95.9 | 98.9 | 97.9 | 95.0 | 94.6 |
| 22 | India | in | 236.7 | 229.3 | 172.3 | 144.5 | 152.5 | 156.2 | 145.2 | 144.7 | 126.2 | 89.7 | 91.0 | 141.2 | 146.7 | 113.3 | 100.2 |
| 23 | Poland | pl | 156.5 | 118.7 | 87.9 | 90.7 | 92.0 | 99.7 | 102.6 | 128.8 | 172.4 | 123.3 | 124.4 | 128.2 | 127.0 | 115.8 | 115.3 |
| 24 | Ireland | ie | 142.2 | 126.3 | 127.9 | 129.2 | 81.1 | 149.0 | 145.3 | 130.8 | 142.8 | 87.7 | 77.9 | 80.3 | 79.5 | 72.5 | 72.2 |
| 25 | Turkey | tr | 120.8 | 153.0 | 121.2 | 142.5 | 166.2 | 147.5 | 123.4 | 119.6 | 103.2 | 80.7 | 73.0 | 75.3 | 74.5 | 67.9 | 67.7 |
| 26 | Finland | fi | 115.8 | 114.1 | 114.6 | 140.7 | 133.6 | 130.8 | 122.4 | 123.9 | 139.3 | 98.3 | 79.5 | 82.0 | 81.1 | 74.0 | 73.7 |
| 27 | Taiwan | tw | 243.8 | 169.9 | 161.7 | 139.8 | 142.5 | 109.1 | 71.4 | 67.0 | 61.2 | 53.9 | 56.3 | 58.0 | 57.5 | 52.4 | 52.2 |
| 28 | Greece | gr | 90.3 | 71.3 | 80.3 | 86.2 | 89.3 | 143.0 | 137.6 | 164.6 | 134.0 | 107.2 | 74.1 | 76.4 | 75.6 | 69.0 | 68.7 |
| 29 | Argentina | ar | 171.3 | 108.7 | 27.9 | 52.3 | 83.9 | 108.2 | 96.3 | 121.5 | 130.1 | 89.2 | 82.7 | 85.3 | 84.4 | 77.0 | 76.7 |
| 30 | China | cn | 79.5 | 75.0 | 163.1 | 198.3 | 211.8 | 119.7 | 70.8 | 56.5 | 57.3 | 28.8 | 23.2 | 23.9 | 92.4 | 84.3 | 105.2 |
These values provide a scaling factor for comparing a chart entry in one place with one in a different year and location. It goves us a measure of the importance of different countries. It also gives us confidence that if we have taken account of the top 10 countries any undiscovered entries in countries below the Netherlands will have little impact on the overall results. This is important since we don't have a reliable source for Brazil's charts.
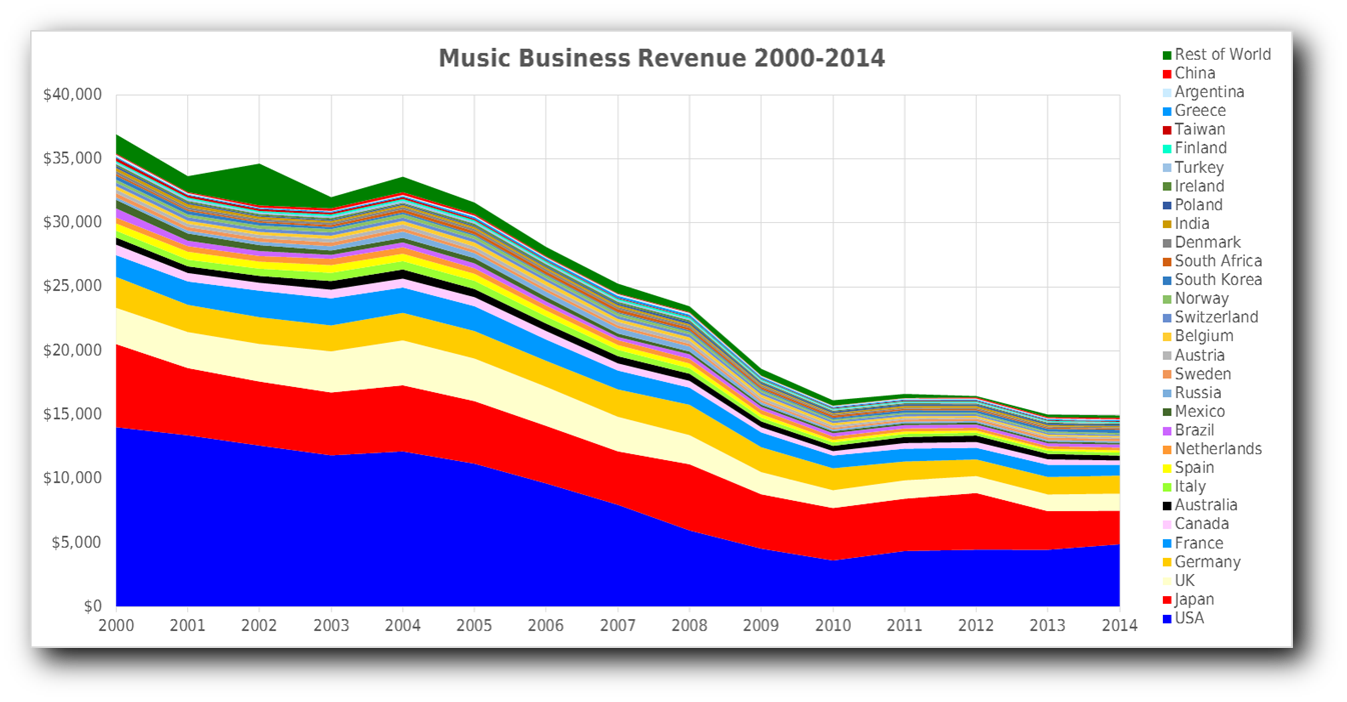
This also allows us to see how the revenues of the music business have dramatically dropped since the year 2000. Another interesting element is that revenue has dropped by 65% in the USA and almost 50% in the UK while over the same period Germany's revenue only dropped 40%. This means that in 2013 Germany overtook the UK to become the 3rd largest market, in 2018 the UK grew enough to retake its 3rd slot. In 2007 Australia overtook Canada to become the 6th largest. So the relative importance of these different territories changed between 2000 and 2014.
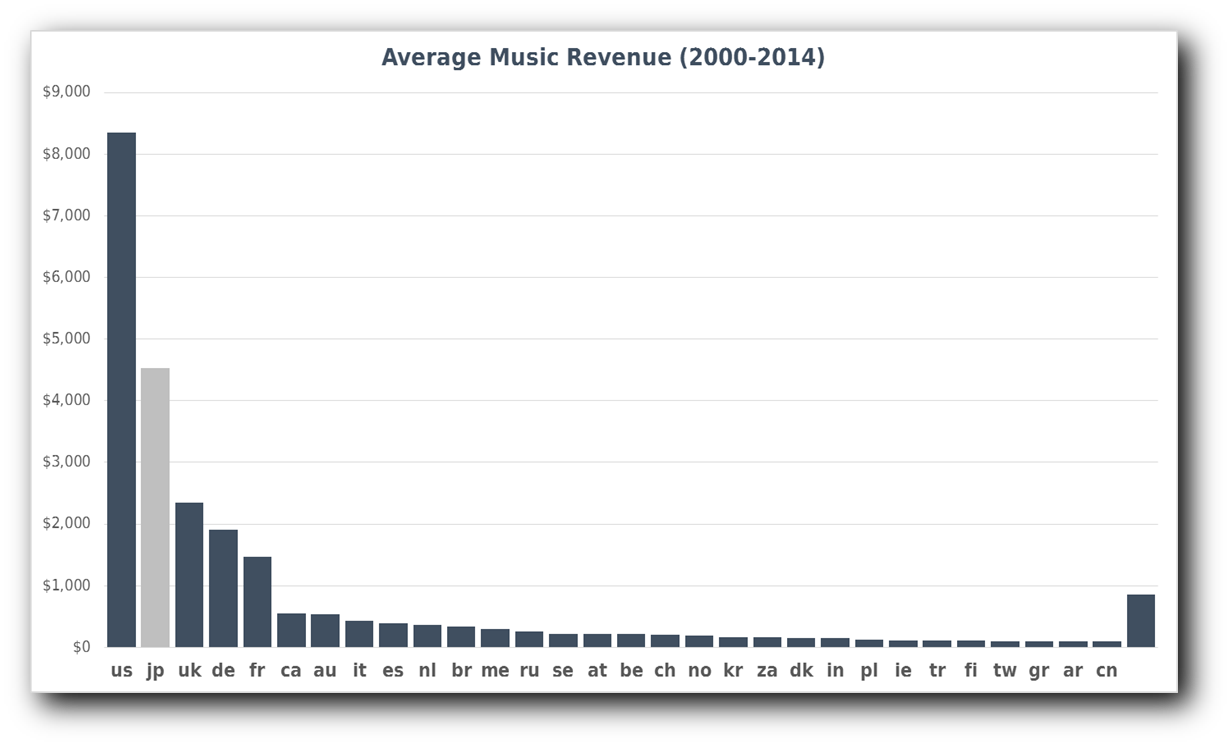
If we average the revenue from each country over this period it is obvious that the sales from the top five countries dominate the total figures. Out of those five the obvious anomaly is Japan, as we have already said most music that is a hit there does not show up in any of the other major countries.
There are two reasons why the total scores for songs, albums and artists can be inconsistent with the sum of their parts. The main one is because of the way scores get assigned to contributing artists. Suppose for example we consider the song "Blurred Lines" by Robin Thicke, T.I. & Pharrell Williams, on its own this gets a score of something like 16,500, so the artist responsible gets assigned that score. In this case the artist "Robin Thicke, T.I. & Pharrell Williams" only had one hit but this was sufficient to make them artist number 281. But the artists "Robin Thicke" and "Pharrell Williams" were notable enough on their own to have individual entries. So we assign an additional 8,250 to each of them for the work they put in to "Blurred Lines". We have had to take a very simplistic approach here, the headline artist gets the full tally of points, any further artists get 50% of the points (however many of them there are). This factor means that an artist which appears in numerous collaborations might get a higher score than one above them in the list.
The second anomaly has to do with the way the "success curve" curves are generated. In order to create the effect we wanted we had to divide the year into a number of equally sized chunks. Processing on a daily basis would give too much detail, using weeks would make handling the switch from one year to the next "challenging" and months have odd lengths through the year. The underlying fact is that unfortunately 365¼ days won't divide evenly into anything. So what we did was split each year into 40 sections (9.125 days each for most years and 9.15 days for leap years). Because we can only process individual days this means that the actual periods are sometimes 9 days and other times 10 days. When we stitch these together there is a potential to get some rounding errors.
So now we have all the elements required to calculate a score over a given period. We first split the timeframe into individual days, then assign scores to each song or album that appears in any chart on that day. The score assigned is calculated from the position and the music revenue in that particular country for the year in question. Here is the Perl code used:
my $year_val_M = market_size($country,$year);
my $num1_val_k = ($year_val_M*10)/365;
return $num1_val_k*(1-log($position)/(log(10)*2.5));
In this case the year value is returned in millions of dollars. We assume that a number one is worth 1% of the daily take (this is not always true but it is about correct and just makes the maths easier). The position then adjusts that (so number 2 is worth 0.87%, number 3 0.81% and so on). We sum up all the scores from charts that day and that provides an overall score for that item on that day in all the charts it appears in.
By adding up all the scores from days in a given month (or year) we can get an idea of which songs and albums were the most successful for any time period.
As you will have seen the total score is an attempt to measure the complete revenue generated by a song or album over a certain period. It does take inflation and currency conversion into account and can approximately be related to total revenue generated across the whole music chain in thousands of dollars. While this is a reasonable mechanism to compare one song with another it would not be valid to use these scores to compare song revenue against album revenue or to deduce the actual dollar value extracted by particular artists, record companies or retailers.
The IFPI estimated annual revenue for recorded music in each country is the basis of the calculations. The ranking positions of each album and single are processed using the zipf ranking to give it a score. The IFPI revenue is then allocated by an algorithm to each item in each country, then the sum of all those is presented in the IR number. The IR numbers are internally consistent enabling valid comparisons across this system, and across time.
Our rough guess is that each unit of Indicative Revenue score represents something like $5,000 of TOTAL revenue generated across the whole music delivery chain (in year 2000 dollars). It is reasonable to expect that artists will get at the very most about 10% of this revenue.
In order to allow readers to generate further insights we have created a "data file" that holds the numerical data used to generate each success plot picture. This can be downloaded by following the link in the text that follows each success plot. This data is in "CSV" format and holds the indicative value for each artist, album or song for the periods they were in the charts.
To take an example the artist "Michael W Smith" has a file called "michael_w_smith.csv" with the first few lines being
| artist | year | period | album_ir | song_ir |
| Michael W Smith | 2000 | 0 | 429.747 | 0.0 |
| Michael W Smith | 2000 | 1 | 334.757 | 0.0 |
| Michael W Smith | 2000 | 2 | 271.311 | 0.0 |
This shows that during the period 1 Jan 2000 to 9 Jan 2000 his average daily indicative revenue from albums was 429.747 from singles it was 0.0.
The one strange element here is the "period", in order to ensure that the plots are consistent each year is divided into 40 sections, during most years these are nominally 9.125 days long, during leap years they are 9.15 days. In practice this means that most periods are 9 days with a few 10 day ones interspersed. Here is a table that identifies when each period starts within the year.
| period | Leap Year | Non-Leap Year | |||
| Start | length | Start | length | ||
| 0 | 01 Jan | 9 | 01 Jan | 9 | |
| 1 | 10 Jan | 9 | 10 Jan | 9 | |
| 2 | 19 Jan | 9 | 19 Jan | 9 | |
| 3 | 28 Jan | 9 | 28 Jan | 9 | |
| 4 | 06 Feb | 9 | 06 Feb | 9 | |
| 5 | 15 Feb | 9 | 15 Feb | 9 | |
| 6 | 24 Feb | 10 | 24 Feb | 9 | |
| 7 | 05 Mar | 9 | 05 Mar | 10 | |
| 8 | 14 Mar | 9 | 15 Mar | 9 | |
| 9 | 23 Mar | 9 | 24 Mar | 9 | |
| 10 | 01 Apr | 9 | 02 Apr | 9 | |
| 11 | 10 Apr | 9 | 11 Apr | 9 | |
| 12 | 19 Apr | 9 | 20 Apr | 9 | |
| 13 | 28 Apr | 10 | 29 Apr | 9 | |
| 14 | 08 May | 9 | 08 May | 9 | |
| 15 | 17 May | 9 | 17 May | 10 | |
| 16 | 26 May | 9 | 27 May | 9 | |
| 17 | 04 Jun | 9 | 05 Jun | 9 | |
| 18 | 13 Jun | 9 | 14 Jun | 9 | |
| 19 | 22 Jun | 10 | 23 Jun | 9 | |
| 20 | 02 Jul | 9 | 02 Jul | 9 | |
| 21 | 11 Jul | 9 | 11 Jul | 9 | |
| 22 | 20 Jul | 9 | 20 Jul | 9 | |
| 23 | 29 Jul | 9 | 29 Jul | 10 | |
| 24 | 07 Aug | 9 | 08 Aug | 9 | |
| 25 | 16 Aug | 9 | 17 Aug | 9 | |
| 26 | 25 Aug | 10 | 26 Aug | 9 | |
| 27 | 04 Sep | 9 | 04 Sep | 9 | |
| 28 | 13 Sep | 9 | 13 Sep | 9 | |
| 29 | 22 Sep | 9 | 22 Sep | 9 | |
| 30 | 01 Oct | 9 | 01 Oct | 9 | |
| 31 | 10 Oct | 9 | 10 Oct | 10 | |
| 32 | 19 Oct | 9 | 20 Oct | 9 | |
| 33 | 28 Oct | 10 | 29 Oct | 9 | |
| 34 | 07 Nov | 9 | 07 Nov | 9 | |
| 35 | 16 Nov | 9 | 16 Nov | 9 | |
| 36 | 25 Nov | 9 | 25 Nov | 9 | |
| 37 | 04 Dec | 9 | 04 Dec | 9 | |
| 38 | 13 Dec | 9 | 13 Dec | 9 | |
| 39 | 22 Dec | 10 | 22 Dec | 10 | |
This site should be considered as a complement to the //tsort.info/ site. This site deals only with charts that are more recent than 1 Jan 2000, while that site is especially good for combining chart positions from multiple sources over a longer period to create reliable results.
| Site | chart2000.com | tsort.info |
| Period | 1 Jan 2000 - 31 Dec 2024 | 1900 - Last year, but results become unreliable after about 2012 |
| Charts | Only notable charts, one for each major country | Any chart that is both available and seems reliable, this becomes more relaxed for earlier time periods and countries that are seldom covered |
| Chart Types | Weekly charts only | Any chart that is applicable: including weekly, monthly and annual charts, lists of gold records, Oscar, Grammy, Brit, Juno and other awards and so on |
| Calculation | Combine daily scores using a justified model and the known music market size in each country | Custom tuned algorithm that provides reasonable results for a the wide range of input dates and chart types employed |
| Style | Clean, data focused (san-serif) | Detailed, focused on interesting results (serif) |
Most of the charts available from before 2000 do not have weekly data (or where they do it is hard to deal with). So the //tsort.info/ algorithm relies on having a relative position and possibly a count of the duration. For the this site's data we are in a much better position, there is enough data to allow us to track the position of songs and albums for every individual day since 2000 in most of the major countries.
We attempt to keep this site as up to date as possible, we gather and process the data at the start of each month. This covers the charts up to the end of the previous month, so when you visit last month's charts should be available.
We rely on data from a number of sources and we believe that our use of these public resources is "Fair Use" because this site presents a transformative view of a small proportion of each source's overall content. This site is an "original work of authorship" that presents a "compilation work". The content here consolidates facts presented within the sources without duplicating the particular form that the sources present them in (and facts are not copyrightable).
The sources provide more than 1,000,000 entries providing weekly positions of 27,000 artist names with 28,000 song titles and 36,500 album names. The output data here lists about 18,000 entries (about 8,000 albums and 9,000 songs) assigned to 2,000 song artists and 1,200 album artist (900 or so artists have both song and album entries).
You can contact us to discuss any issues, suggest data fixes or complain about the positioning of your favourite artist by filling in the form at the bottom of each page.
For any other queries you can also email 
Previous Comments (newest first)
29 Apr 2023
re: Incomplete data?
My bad, I think it's because each month is limited to 50 songs per month.
I don't suppose it's possible to provide a file with the top 100 songs for each month?
No, at 50 per month it is clear that our listing is a reasonable subset of all our sources, so does not break copyright. At 100 per mont that would be less easy to argue.
24 Jan 2022
Message
Hello, can you please also provide a file of chart2000 just as tsort-chart-2-8-0044.csv on this site, which contains a complete set of the data published on site chart2000.com in a form that is convenient (since it is in a single place) and easy to manipulate? I've checked your Top Items file and it's not complete, some of the top 100 songs for every year were not listed. And when will you update the chart for rest of the year 2021?
The structure of this site makes it rather hard to list all the items here, for example would you want such a file to contain the daily listings?
We try and provide CSV files with all the varients.
27 Sep 2021
Most successful artist of the 2010s?
Based on your data, who are the top 5 charting artists of the 2000s? and the 2010s?+
See the files
22 Sep 2021
CSV file usage
Hi, I would like to ask if it is okay to use one of your csv dataset for aschool project that I have. I will definitely credit this website in however format you need. I love the work that you've done. Thanks!
You can use the CSV files for whatever you want as long as you credit this website (and list the version number from the bottom of the page)
19 May 2020
Column Name Questions
Hi, I'm using your data for a college project and we were just wondering what your columns represent. What is the "position" column is off of? I'm also trying to figure out what the country columns (F-K) mean. Thank you!
The sources are described in the "Notes" page. The position shows the peak that item reached in the period listed.
1 Nov 2018
German
German Charts have not fixed at all
The fact that a site puts the string "Official" in their name does not make them the definitive chart. We will have a look at that site and, if it possible to use it and it looks trustworthy we will consider using it.
26 Jul 2017
German Charts
In Your Calculations the German Charts are extremely under-represented.Here You can find the complete Top-100 Singles- and Albumcharts: www.offiziellecharts.de I wish you will include the full german ccharts in your calculations. By the Way - very good side!!
Best Wishes
Herby
We'll take a look at it, thanks